import numpy as np
import matplotlib.pyplot as plt
logistic = lambda u: 1/(1 + np.exp(-u))
squared_loss = lambda u, y: (logistic(u)-y)**2
u = np.linspace(-8, 8, 200)
plt.figure(figsize=(8, 4))
plt.plot(u, squared_loss(u, 0), linestyle='--')
plt.plot(u, squared_loss(u, 1), linestyle='--')
plt.legend(["Squared loss if $y = 0$", "Squared loss if $y = 1$"])
plt.xlabel("$u$")
plt.ylabel("Loss")
plt.title("Squared Loss")
Text(0.5, 1.0, 'Squared Loss')
logistic_loss = lambda u, y: -y*np.log(logistic(u)) - (1-y)*np.log(1-logistic(u))
u = np.linspace(-8, 8, 1000)
plt.figure(figsize=(8, 4))
plt.plot(u, logistic_loss(u, 0), linestyle='--')
plt.plot(u, logistic_loss(u, 1), linestyle='--')
plt.legend(["Logistic loss if $y = 0$", "Logistic loss if $y = 1$"])
plt.xlabel("$u$")
plt.ylabel("Loss")
Text(0, 0.5, 'Loss')
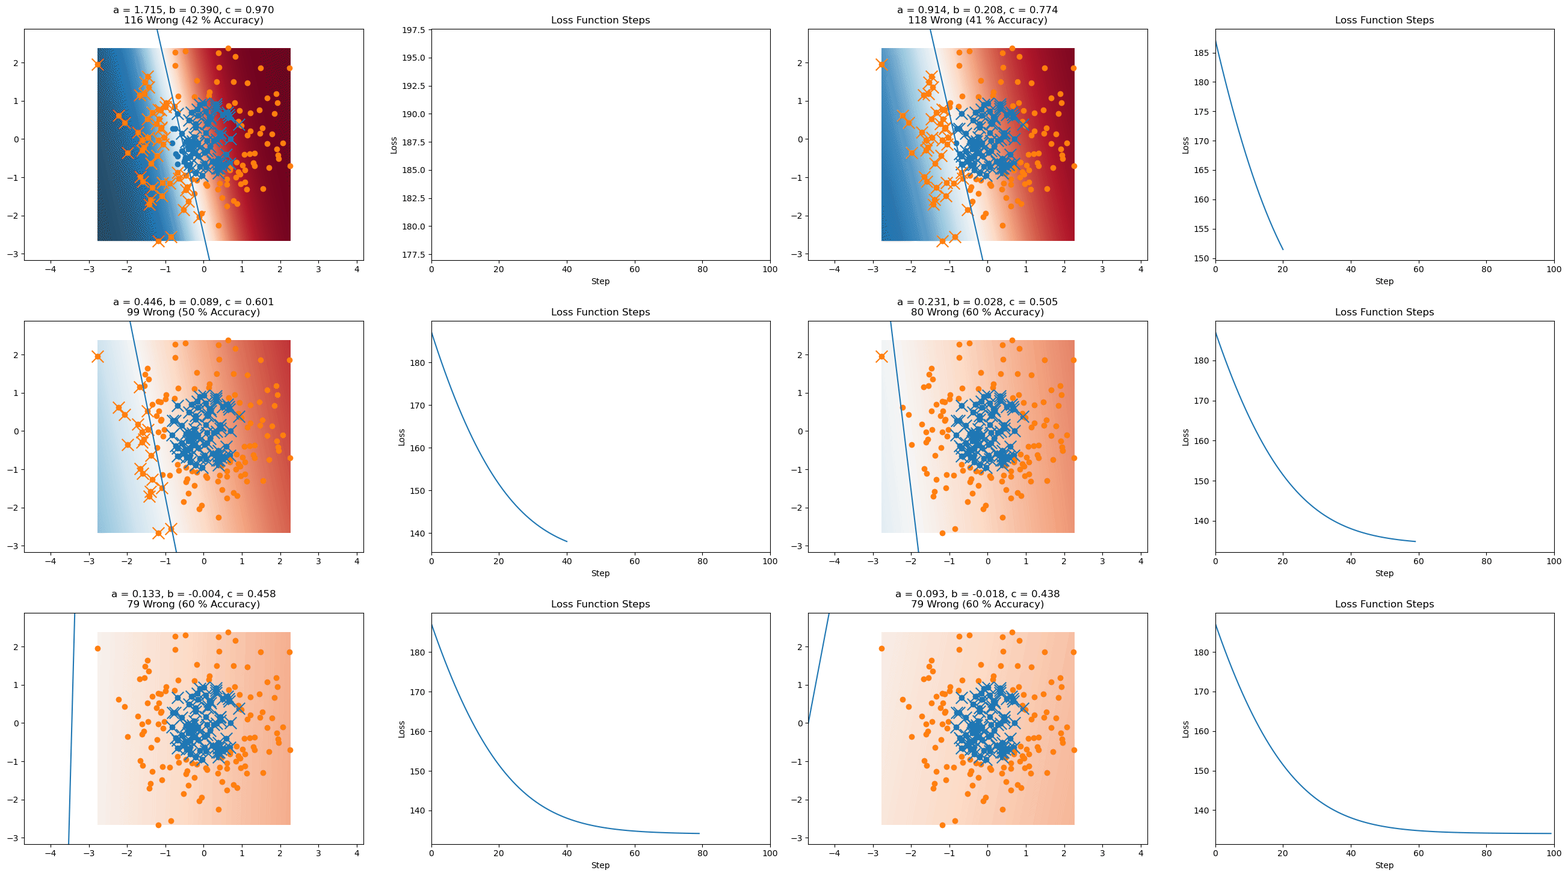
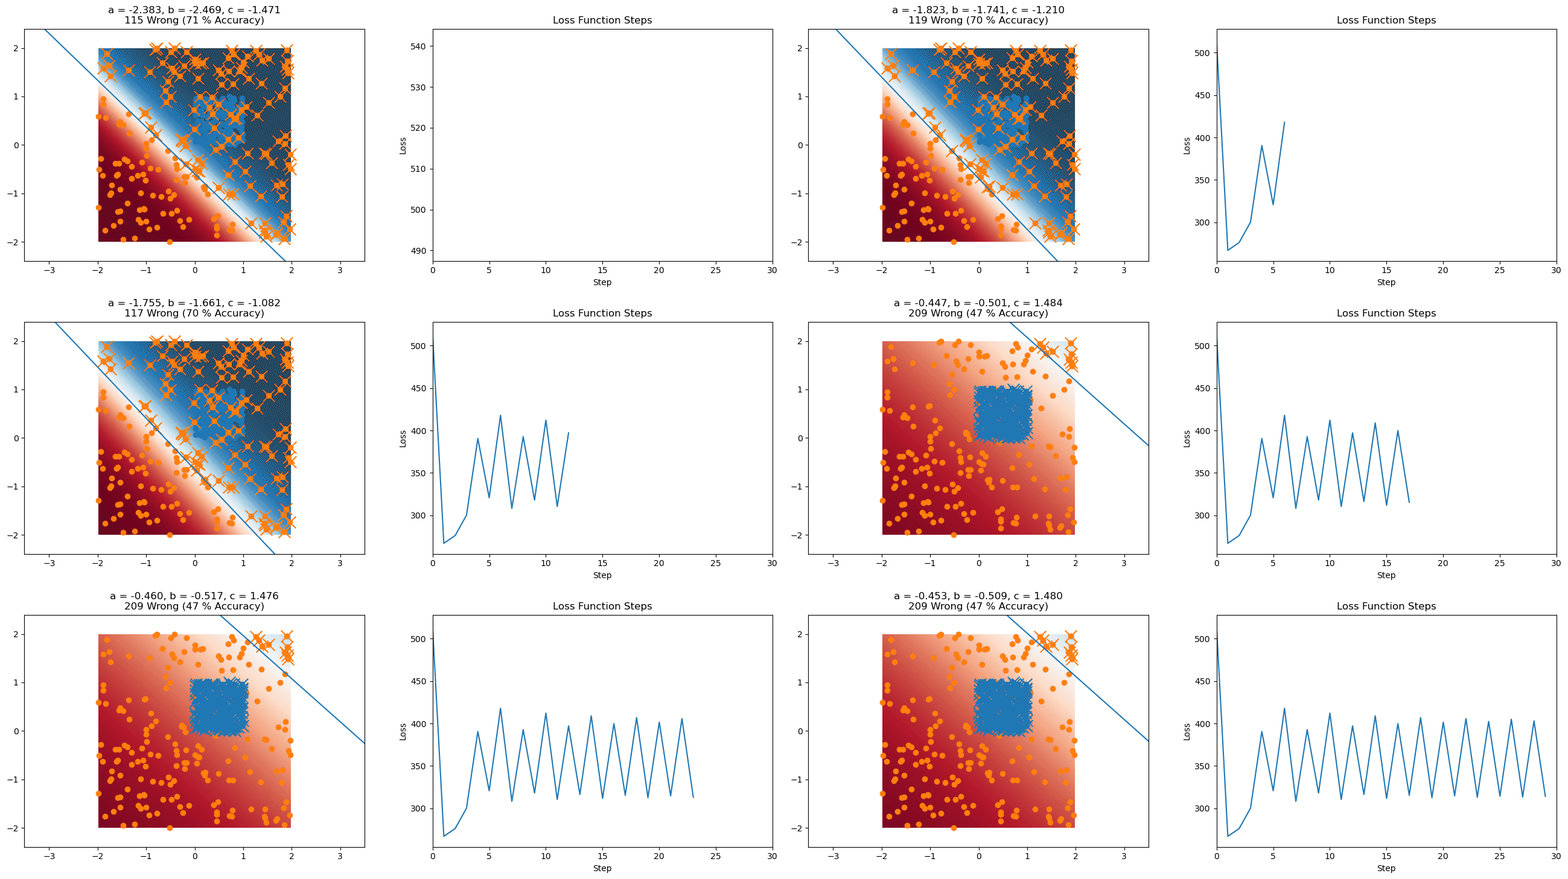
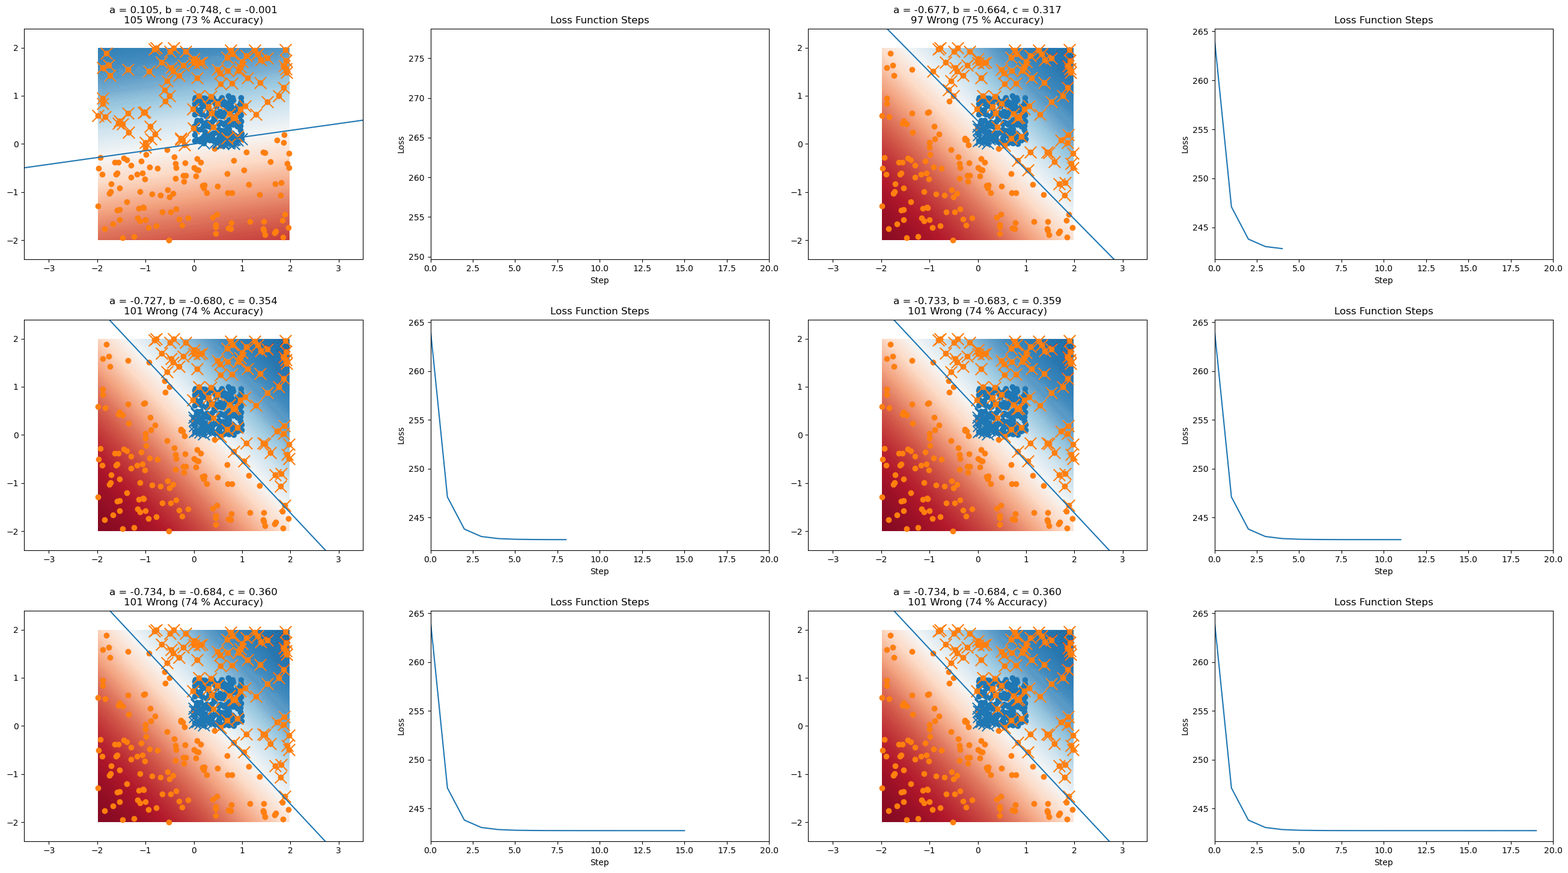
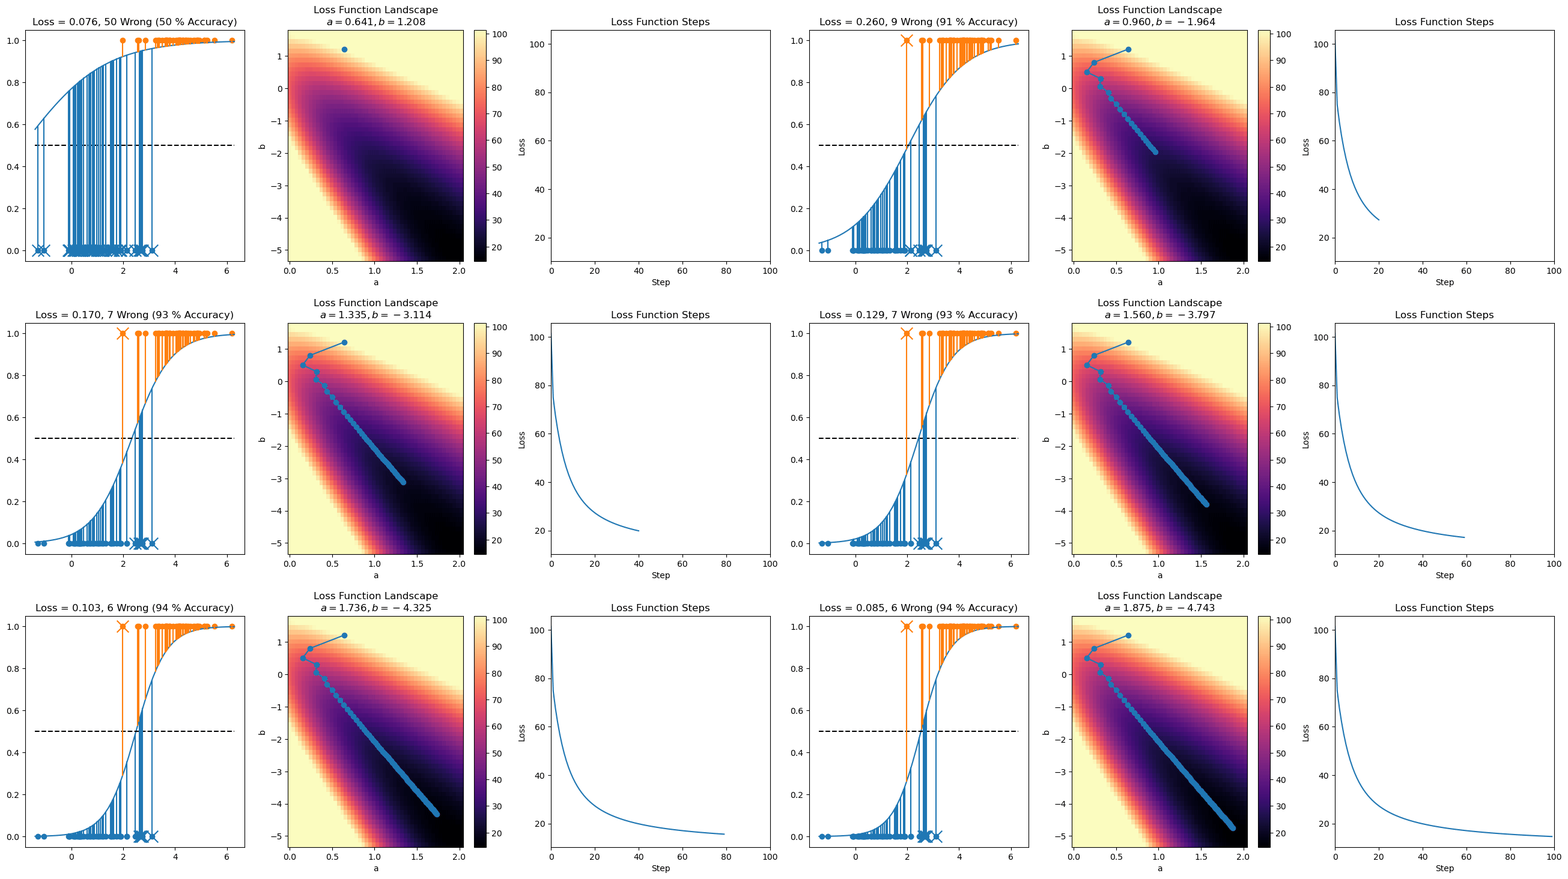
We have a "learning rate" $\alpha$, which is how quickly we move across our parameter space.
Gradient descent: Taking gradual steps against the "gradient" (multidimensional derivative) until we reach a minimum loss in our parameter space, and we "converge" to a good set of parameter choices
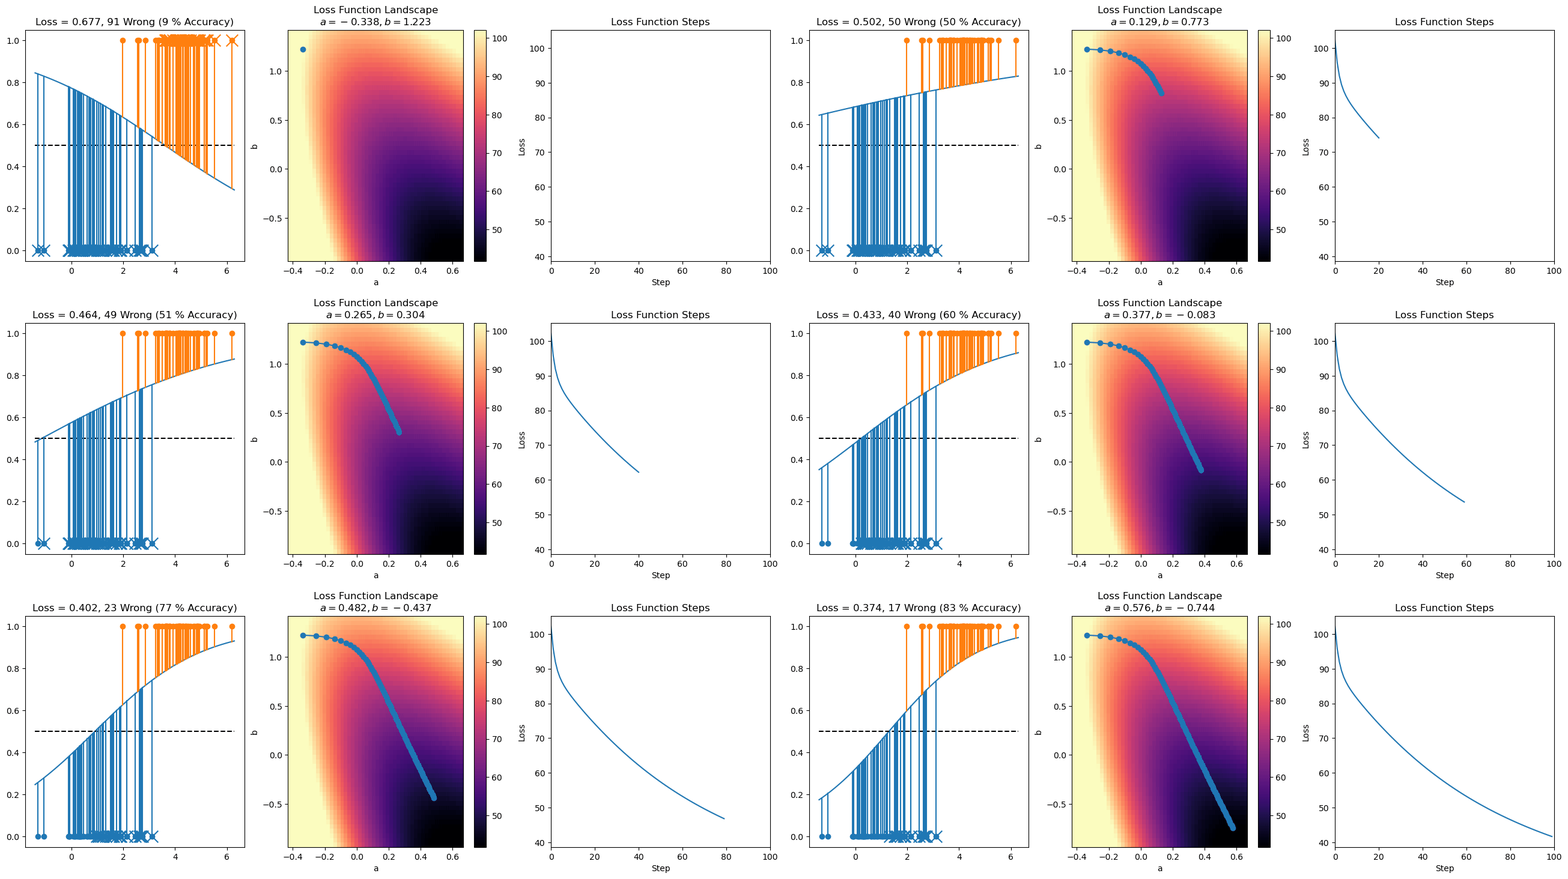
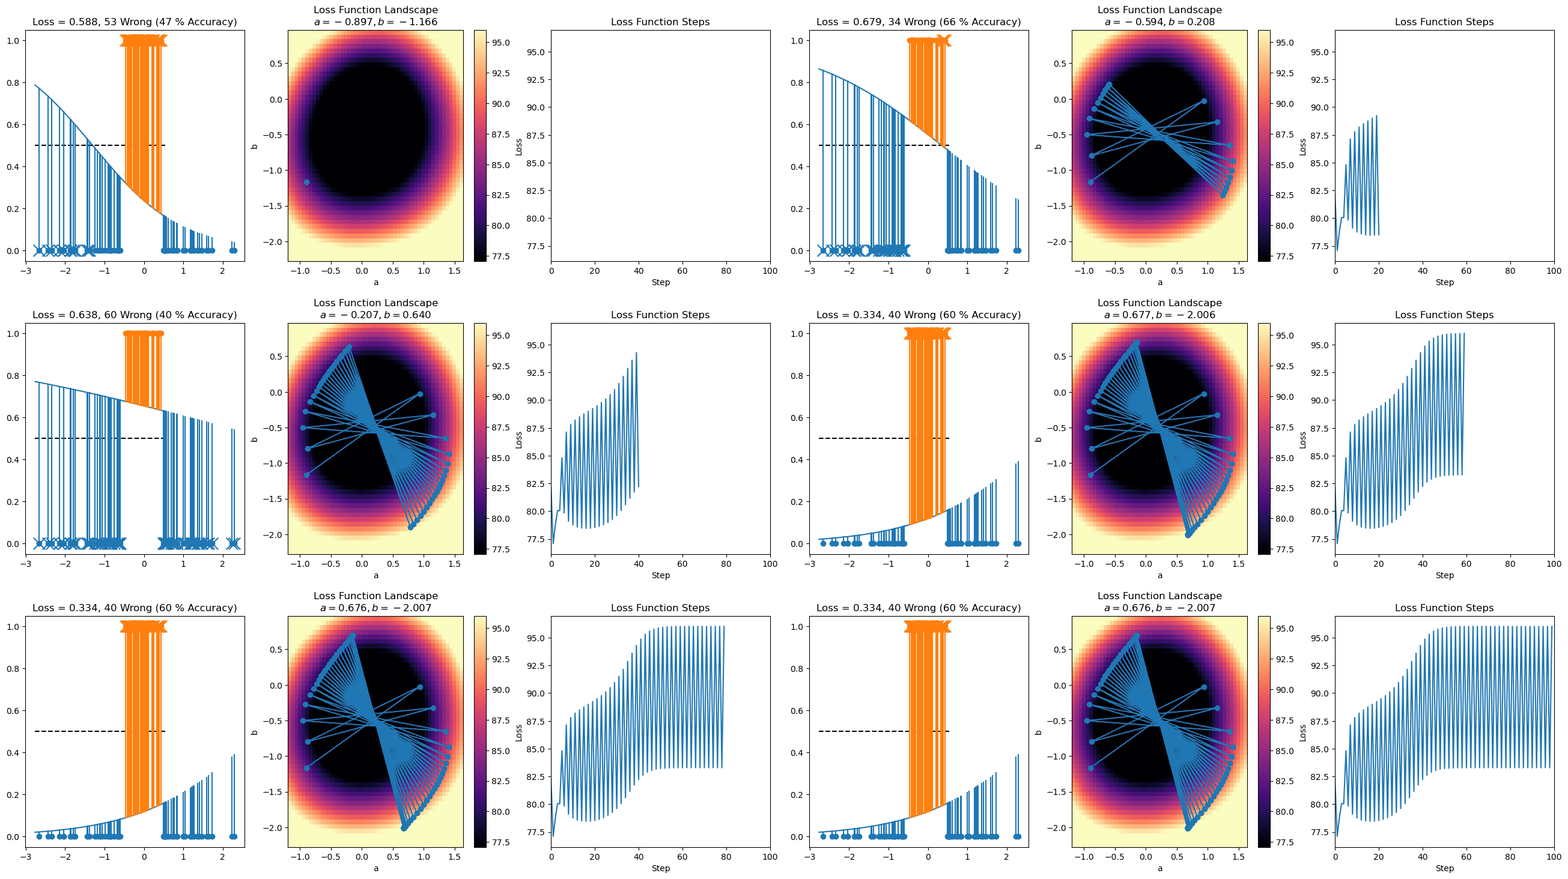
If the learning rate is too big, we take steps that are too big and oscillate back and forth
If our learning rate is too small, we're safe in a sense, but it might take too long to converge to a good choice of parameters
def plot_logistic_neighborhood(x, y, amin, amax, bmin, bmax, res=50, loss_fn=logistic_loss, vmin=None, vmax=None):
"""
Plot a neighborhood of a loss function evaluated on a set of points
Parameters
----------
x: ndarray(N)
The 1D inputs
y: ndarray(N)
The labels
amin, amax, bmin, bmax
Neighborhood around which to display values
res: int
Resolution to search around (a, b)
loss_fn: (x, y) -> float
Loss function to apply pointwise to a bunch of estimates
vmin: float
vmin for colormap
vmax: float
vmax for colormap
"""
aa = np.linspace(amin, amax, res)
bb = np.linspace(bmin, bmax, res)
aa, bb = np.meshgrid(aa, bb)
I = np.zeros_like(aa)
for i in range(I.shape[0]):
for j in range(I.shape[1]):
I[i, j] = np.sum(loss_fn(aa[i, j]*x + bb[i, j], y))
if not vmax:
vmin = np.min(I)
vmax = np.max(I)
plt.imshow(I, cmap='magma', extent=(amin, amax, bmax, bmin), aspect='auto', vmin=vmin, vmax=vmax)
plt.xlabel("a")
plt.ylabel("b")
plt.colorbar()
plt.gca().invert_yaxis()
def plot_logistic_regression_predictions(x, y, a, b, loss_fn=logistic_loss):
"""
Plot the predictions of a 1D logistic regression function
Parameters
----------
x: ndarray(N)
The 1D inputs
y: ndarray(N)
The labels
a: float
a in the model
b: float
b in the model
loss_fn: (x, y) -> float
Loss function to apply pointwise to a bunch of estimates
"""
x0 = x[y == 0]
x1 = x[y == 1]
plt.scatter(x0, np.zeros(x0.size))
plt.scatter(x1, np.ones(x1.size))
x = np.linspace(np.min(x0)-0.1, np.max(x1)+0.1)
y = a*x + b
plt.plot(x, logistic(y))
plt.plot(x, 0.5*np.ones(x.size), c='k', linestyle='--')
wrong = 0
for x in x0:
y = logistic(a*x + b)
plt.plot([x, x], [0, y], c='C0')
if y > 0.5:
plt.scatter([x], [0], 200, c='C0', marker='x')
wrong += 1
for x in x1:
y = logistic(a*x + b)
plt.plot([x, x], [1, y], c='C1')
if y < 0.5:
plt.scatter([x], [1], 200, c='C1', marker='x')
wrong += 1
loss = np.sum(loss_fn(a*x+b, y))
N = x0.size + x1.size
plt.title("Loss = {:.3f}, {} Wrong ({} % Accuracy)".format(loss, wrong, int(100*(N-wrong)/N)))
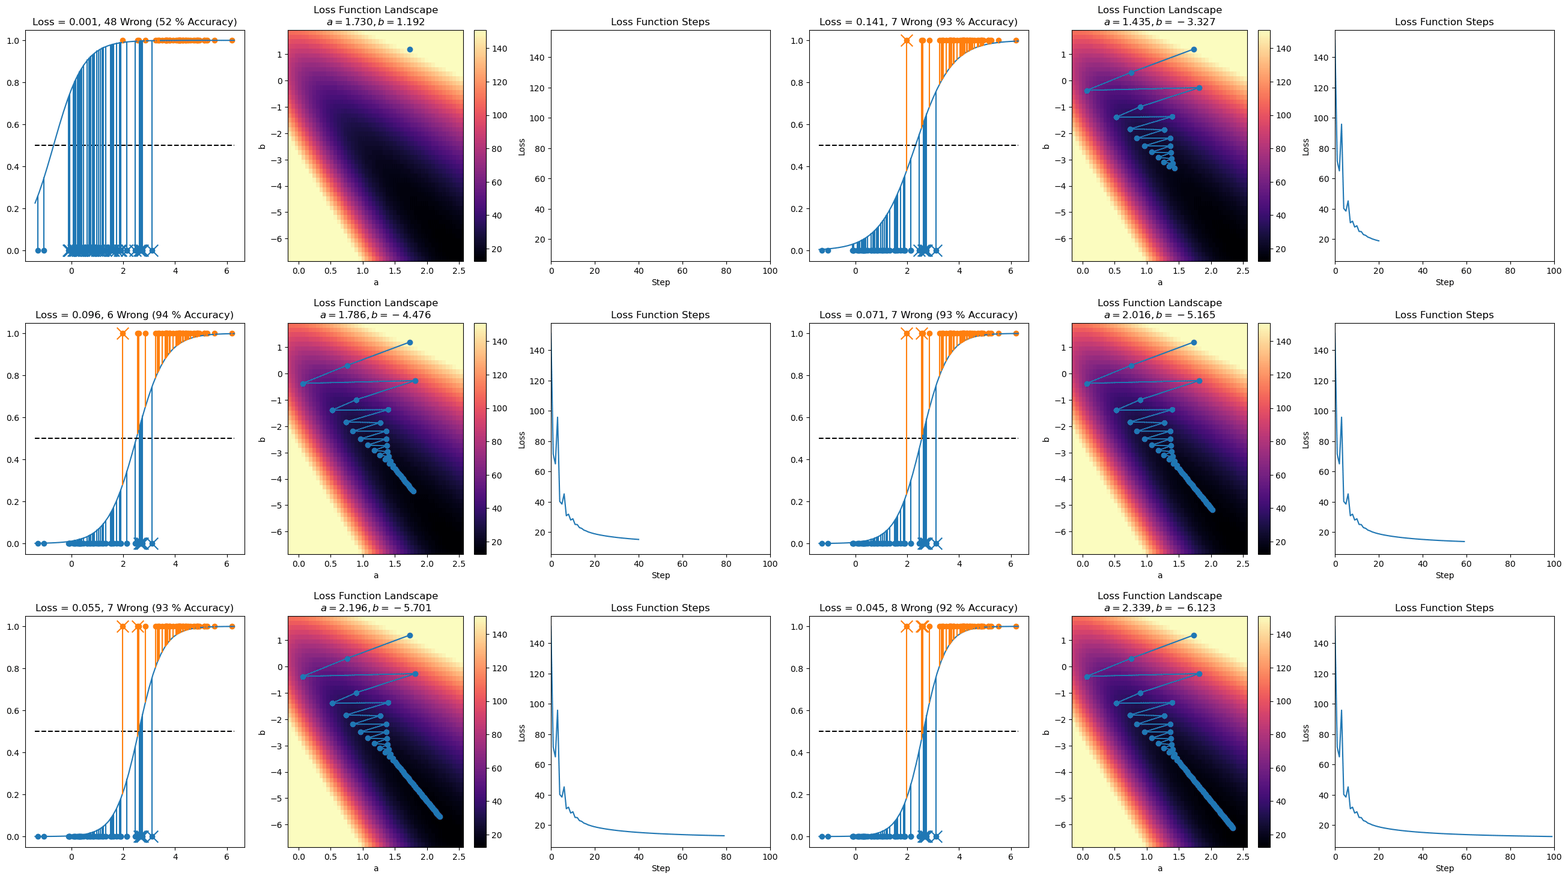
np.random.seed(2)
N = 100
# Example 1
x = np.random.randn(N) + 1
y = np.zeros(N)
x = np.concatenate((x, np.random.randn(N)+4))
y = np.concatenate((y, np.ones(N)))
# Example 2
#x = np.random.randn(N)
#y = np.abs(x) < 0.5
a_initial, b_initial = np.random.randn(2)
lr = 0.01
n_iters = 30
losses = []
steps = []
a = a_initial
b = b_initial
for it in range(n_iters):
## TODO: Update a and b with gradient descent
f = logistic(a*x + b)
a += lr*np.sum(x*(y-f))
b += lr*np.sum(y-f)
steps.append([a, b])
loss = np.sum(logistic_loss(a*x+b, y))
losses.append(loss)
mins = np.min(np.array(steps), axis=0)
maxs = np.max(np.array(steps), axis=0)
dr = maxs-mins
lossmin = np.min(losses)
lossmax = np.max(losses)
losses = []
steps = []
a = a_initial
b = b_initial
plt.figure(figsize=(16, 5))
for it in range(n_iters):
f = logistic(a*x + b)
delta = y - f
a += lr*np.sum(x*(y-f))
b += lr*np.sum(y-f)
steps.append([a, b])
loss = np.sum(logistic_loss(a*x+b, y))
losses.append(loss)
plt.clf()
plt.subplot(131)
plot_logistic_regression_predictions(x, y, a, b)
plt.subplot(132)
plot_logistic_neighborhood(x, y, mins[0]-dr[0]*0.1, maxs[0]+dr[0]*0.1, mins[1]-dr[1]*0.1, maxs[1]+dr[1]*0.1, vmin=lossmin, vmax=lossmax)
plt.plot(np.array(steps)[:, 0], np.array(steps)[:, 1])
plt.scatter(np.array(steps)[:, 0], np.array(steps)[:, 1])
plt.title("Loss Function Landscape\n$a={:.3f}, b={:.3f}$".format(a, b))
plt.subplot(133)
plt.plot(losses)
plt.title("Loss Function Steps")
plt.xlabel("Step")
plt.ylabel("Loss")
plt.xlim([0, n_iters])
plt.ylim([lossmin-(lossmax-lossmin)*0.05, lossmax+(lossmax-lossmin)*0.05])
plt.savefig("Iter{}.png".format(it), facecolor='white', bbox_inches='tight')
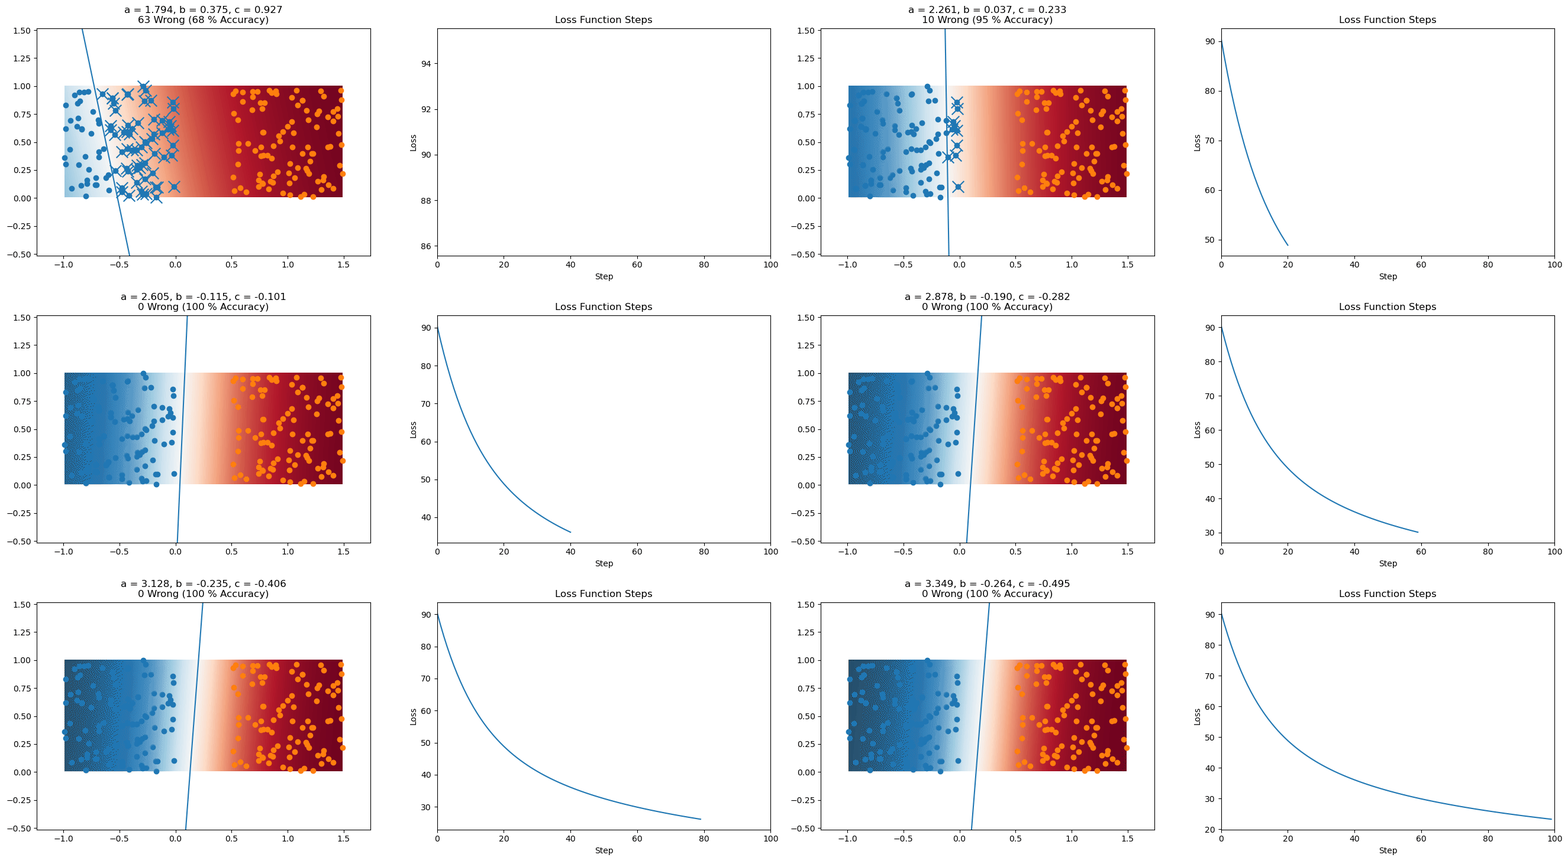
In general, we have an affine function in any dimension composed with $\sigma$
and the update rules are
def plot_logistic_regression_predictions(X1, X2, a, b, c):
plt.scatter(X1[:, 0], X1[:, 1])
plt.scatter(X2[:, 0], X2[:, 1])
X = np.concatenate((X1, X2), axis=0)
xmin = np.min(X, axis=0)
xmax = np.max(X, axis=0)
iv = max(xmax[1]-xmin[1], xmax[0]-xmin[0])
resol = 200
mx = 2
xx = np.linspace(xmin[0], xmax[0], resol)
yy = np.linspace(xmin[1], xmax[1], resol)
xx, yy = np.meshgrid(xx, yy)
plt.imshow(logistic(a*xx+b*yy+c), extent=(xmin[0], xmax[0], xmax[1], xmin[1]), cmap='RdBu_r', vmin=0, vmax=1)
p0 = -c*np.array([a, b])/(a**2 + b**2)
v = np.array([-b, a])
mag = np.sqrt(np.sum(v**2))
if mag > 0:
v = v/mag
p = p0 - 2*iv*v
q = p0 + 2*iv*v
plt.plot([p[0], q[0]], [p[1], q[1]])
rg = xmax[0] - xmin[0]
plt.xlim([xmin[0]-0.2*rg, xmax[0]+0.2*rg])
rg = xmax[1] - xmin[1]
plt.ylim([xmin[1]-0.2*rg, xmax[1]+0.2*rg])
wrong = 0
for x in X1:
y = logistic(a*x[0] + b*x[1] + c)
proj = p0 + np.sum(v*(x-p0))*v
#plt.plot([x[0], proj[0]], [x[1], proj[1]], c='C0')
if y > 0.5:
plt.scatter([x[0]], [x[1]], 200, c='C0', marker='x')
wrong += 1
for x in X2:
y = logistic(a*x[0] + b*x[1] + c)
proj = p0 + np.sum(v*(x-p0))*v
#plt.plot([x[0], proj[0]], [x[1], proj[1]], c='C1')
if y < 0.5:
plt.scatter([x[0]], [x[1]], 200, c='C1', marker='x')
wrong += 1
N = X.shape[0]
plt.title("a = {:.3f}, b = {:.3f}, c = {:.3f}\n{} Wrong ({} % Accuracy)".format(a, b, c, wrong, int(100*(N-wrong)/N)))
plt.axis("equal")
np.random.seed(0)
a_initial, b_initial, c_initial = np.random.randn(3)
lr = 0.01
n_iters = 20
# Example 1
#X0 = np.random.rand(100, 2) - np.array([[1, 0]]) # 100 0 examples between x = [-1, 0], y = [0, 1]
#X1 = np.random.rand(100, 2) + np.array([[0.5, 0]])
#X = np.concatenate((X0, X1), axis=0)
#y = np.zeros(X.shape[0])
#y[X0.shape[0]::] = 1
# Example 2
#X = np.random.randn(200, 2)
#r = np.sqrt(np.sum(X**2, axis=1))
#X0 = X[r < 1, :] # Examples that have radius < 1
#X1 = X[r >= 1, :] # Examples that have radius >= 1
#y = r >= 1
# Example 3
X0 = np.random.rand(200, 2)
X1 = 4*np.random.rand(200, 2) - 2
X = np.concatenate((X0, X1), axis=0)
y = np.zeros(X.shape[0])
y[X0.shape[0]::] = 1
losses = []
steps = []
a = a_initial
b = b_initial
c = c_initial
xmin = np.min(X, axis=0)
xmax = np.max(X, axis=0)
rg = xmax-xmin
xmin -= 0.1*rg
xmax += 0.1*rg
plt.figure(figsize=(16, 5))
for it in range(n_iters):
f = logistic(a*X[:, 0] + b*X[:, 1] + c)
a += lr*np.sum(X[:, 0]*(y-f))
b += lr*np.sum(X[:, 1]*(y-f))
c += lr*np.sum(y-f)
steps.append([a, b, c])
loss = np.sum(logistic_loss(a*X[:, 0] + b*X[:, 1] + c, y))
losses.append(loss)
plt.clf()
plt.subplot(121)
plot_logistic_regression_predictions(X0, X1, a, b, c)
plt.xlim(xmin[0], xmax[0])
plt.ylim(xmin[1], xmax[1])
plt.subplot(122)
plt.plot(losses)
plt.title("Loss Function Steps")
plt.xlabel("Step")
plt.ylabel("Loss")
plt.xlim([0, n_iters])
plt.savefig("Iter{}.png".format(it), facecolor='white', bbox_inches='tight')